Observability
Observability is a first-class citizen of GatewayD. It generates logs, metrics and traces to make it easier to see what is going on inside. The support for better observability includes support for multiple loggers, logging to multiple outputs, performance metrics and traces of almost everything happening internally.
Configuration
The configuration parameters for logging and metrics are available in the global configuration file: gatewayd.yaml. Tracing can be enabled via the --tracing flag of the run subcommand of the CLI.
Logs
GatewayD supports multiple loggers. Each logger can send logs to multiple outputs, including console, stdout, stderr, file, Syslog and Rsyslog. The loggers generate structured logs, which can be easily parsed by log aggregators such as fluentbit. The log messages are also human-readable, as shown in the example below.
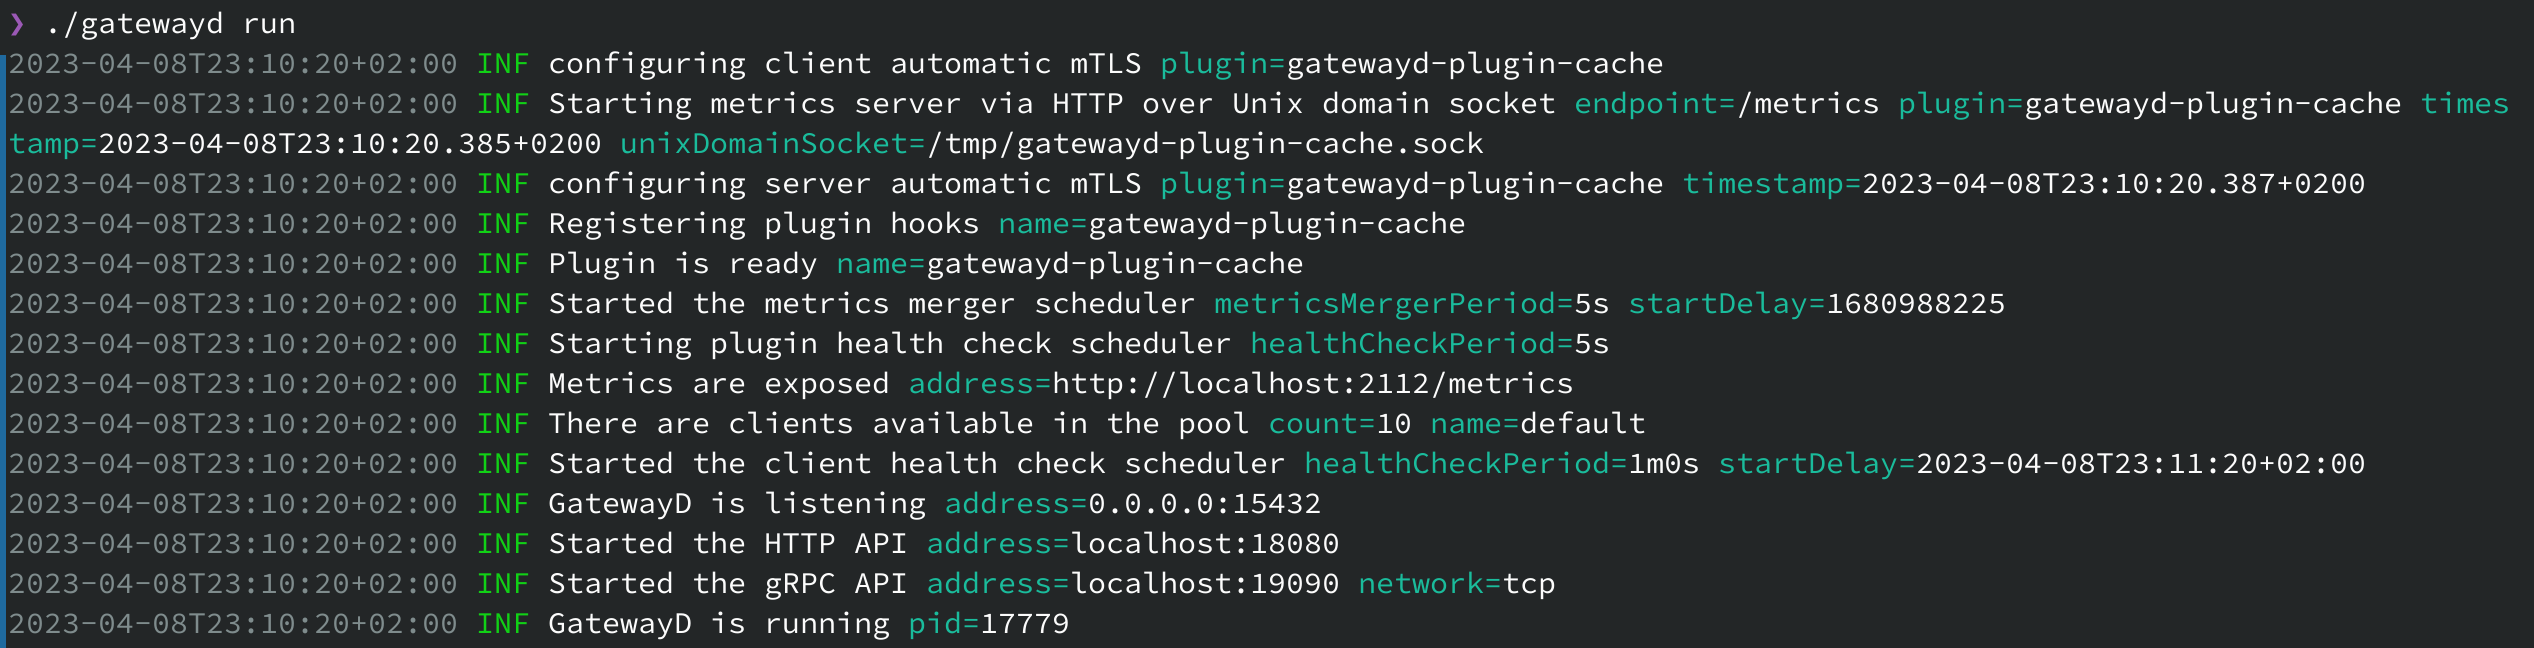
Logs generated by the plugins are aggregated by GatewayD and sent to the loggers with an extra key/value field, for example plugin=gatewayd-plugin-cache, so that they can be filtered out for analysis.
Plugins have their own log level settings, which can be configured in the plugins configuration file: gatewayd_plugins.yaml.
The log level of GatewayD affects the aggregation of logs from the plugins. For example, if the log level of GatewayD is set to info, all the deubg logs from plugins will be discarded.
Metrics
Metrics are exposed from GatewayD and the plugins in Prometheus format. GatewayD has a metrics server and a metrics merger, that collects, relabels and merges Prometheus metrics from all the plugins. The metrics server exposes all the metrics over http://localhost:9090/metrics by default. Metrics server is configurable and the configuration parameters of the metrics merger are available via the plugins’ general configuration. List of built-in metrics are available here.
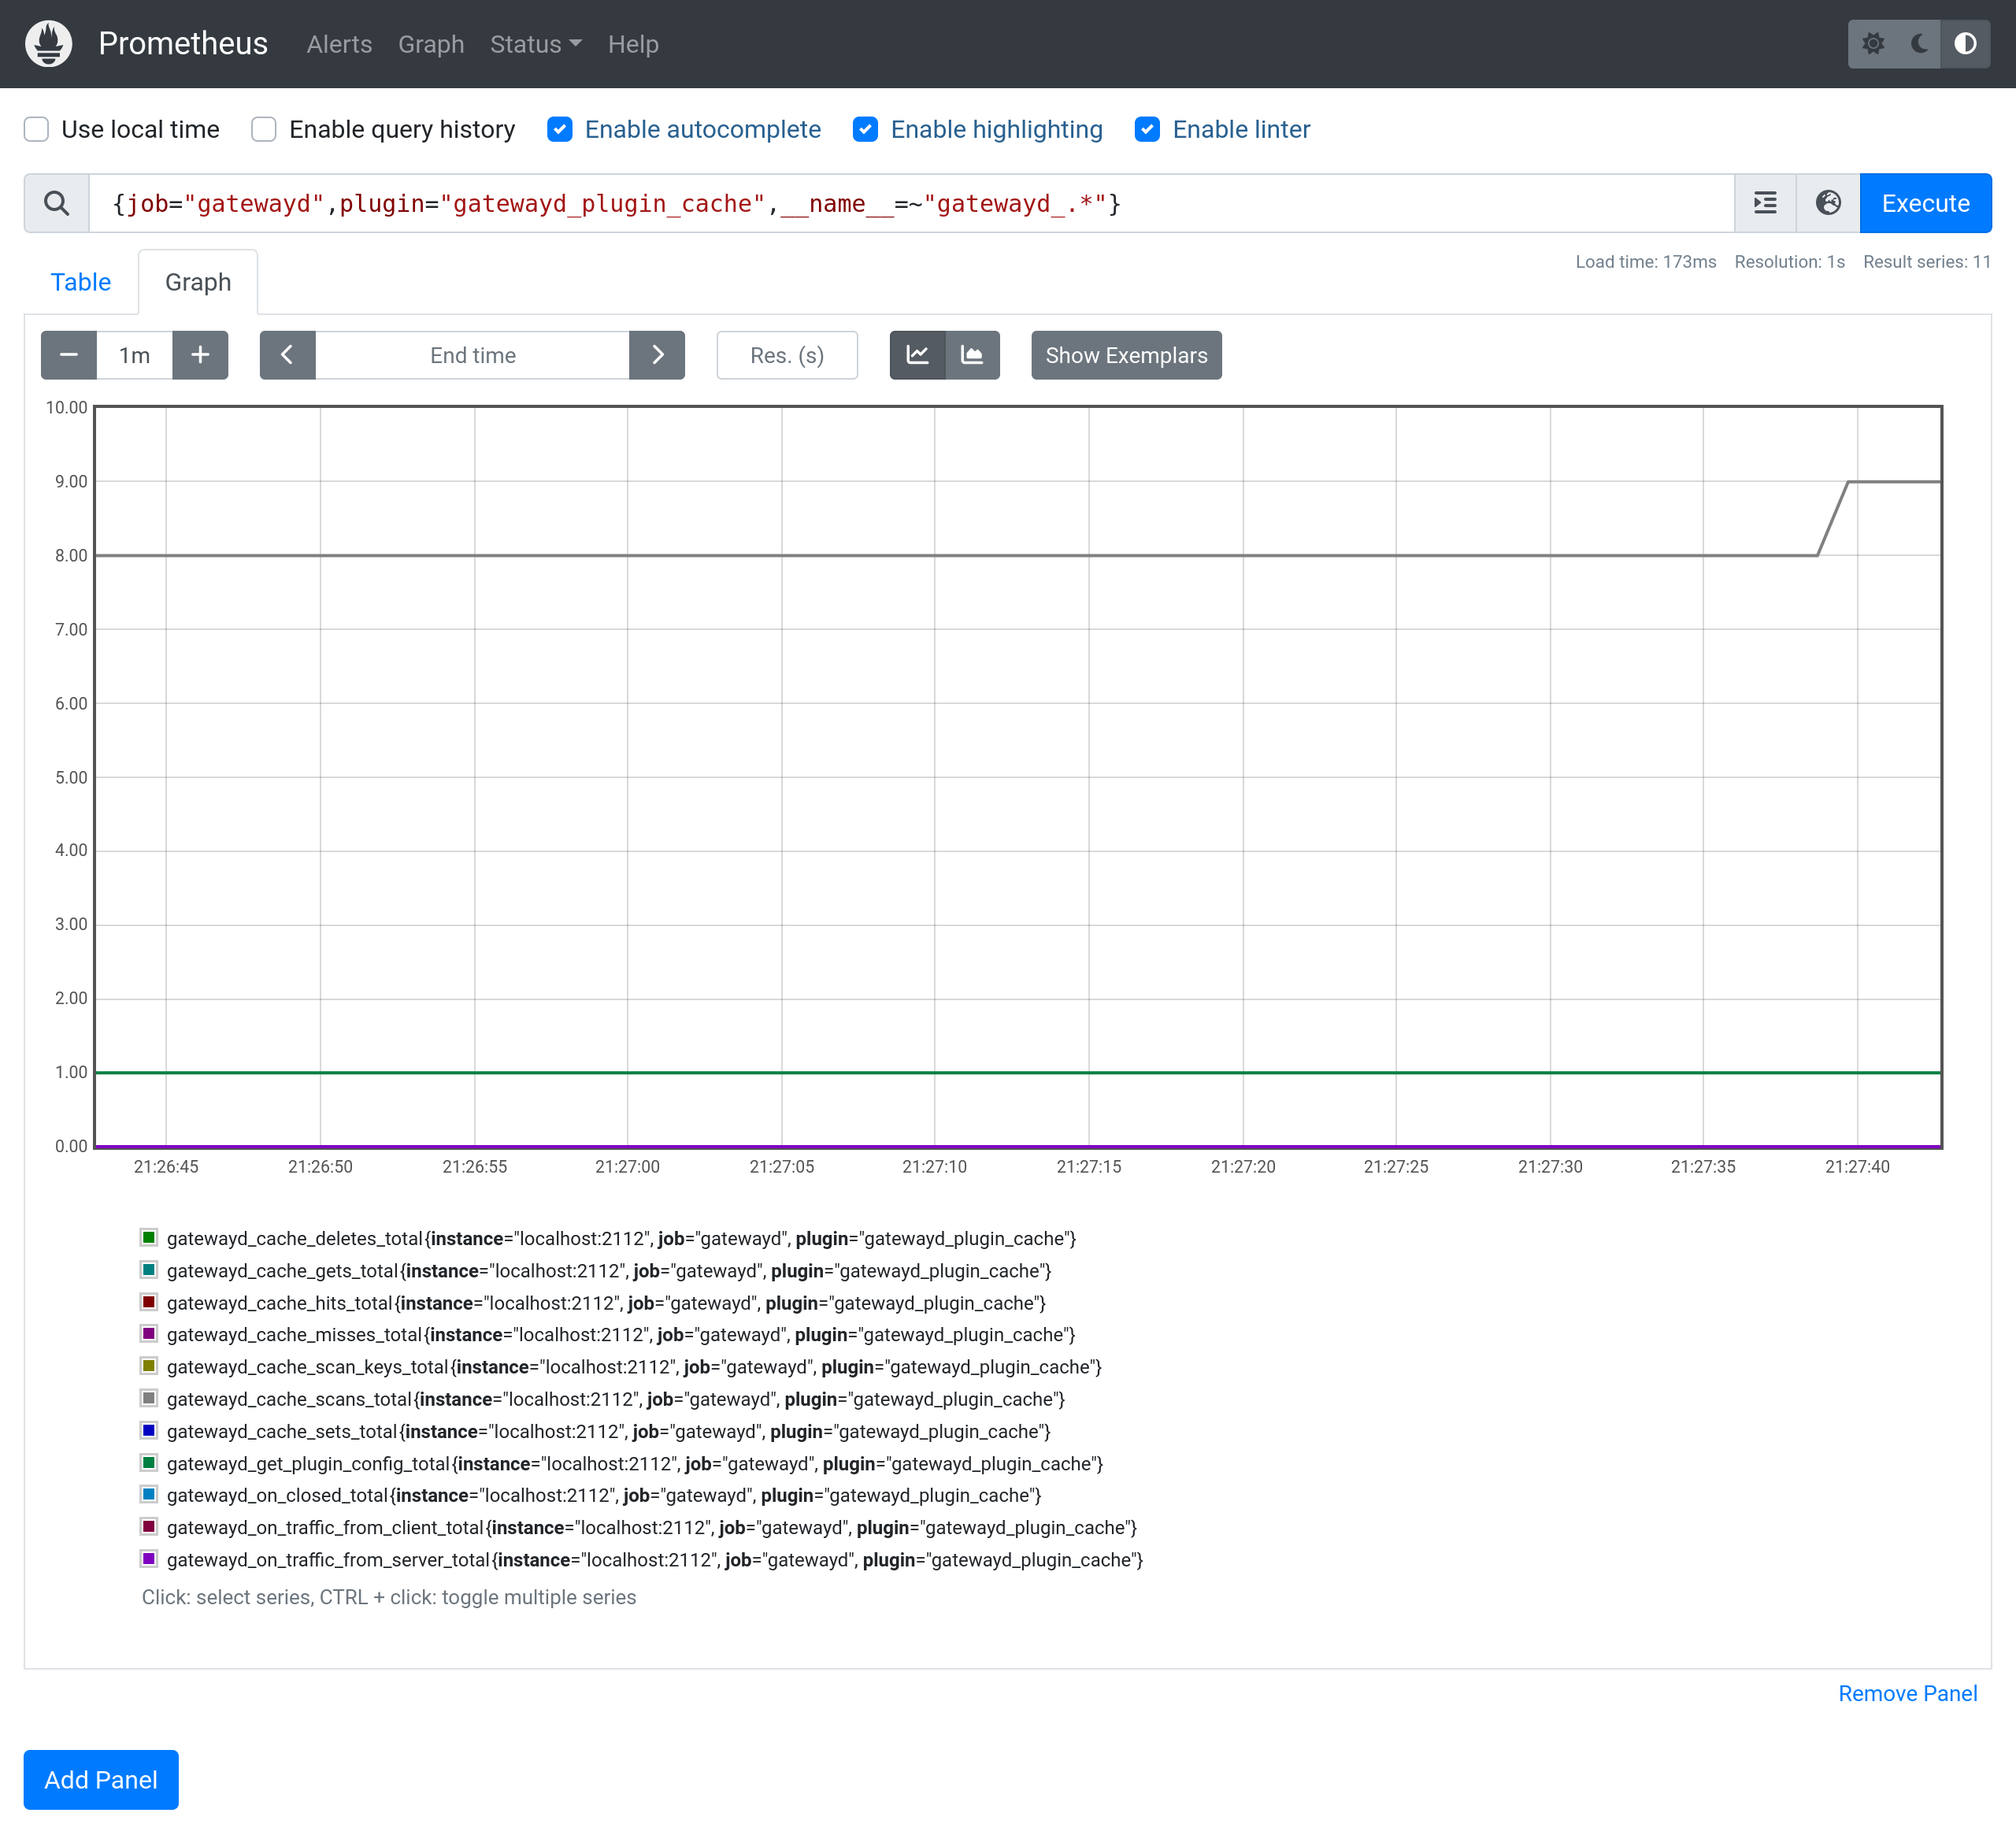
Metrics generated by the plugins are aggregated by GatewayD and exposed over the Unix Domain Socket, so that the metrics merger can read them, relabel them with an extra label, for example plugin=gatewayd_plugin_cache and merged with the metrics of GatewayD. The extra label is added, so that the plugins metrics can be filtered out for analysis.
Plugins can choose to expose metrics to GatewayD. The metrics merger can be configured in the plugins configuration and the metrics merger can be configured in the general plugin configuration.
Traces
Tracing can be enabled from the CLI. Once enabled, GatewayD will send traces in OpenTelemetry format via gRPC to supported backends, such as Jaeger and Grafana Tempo.
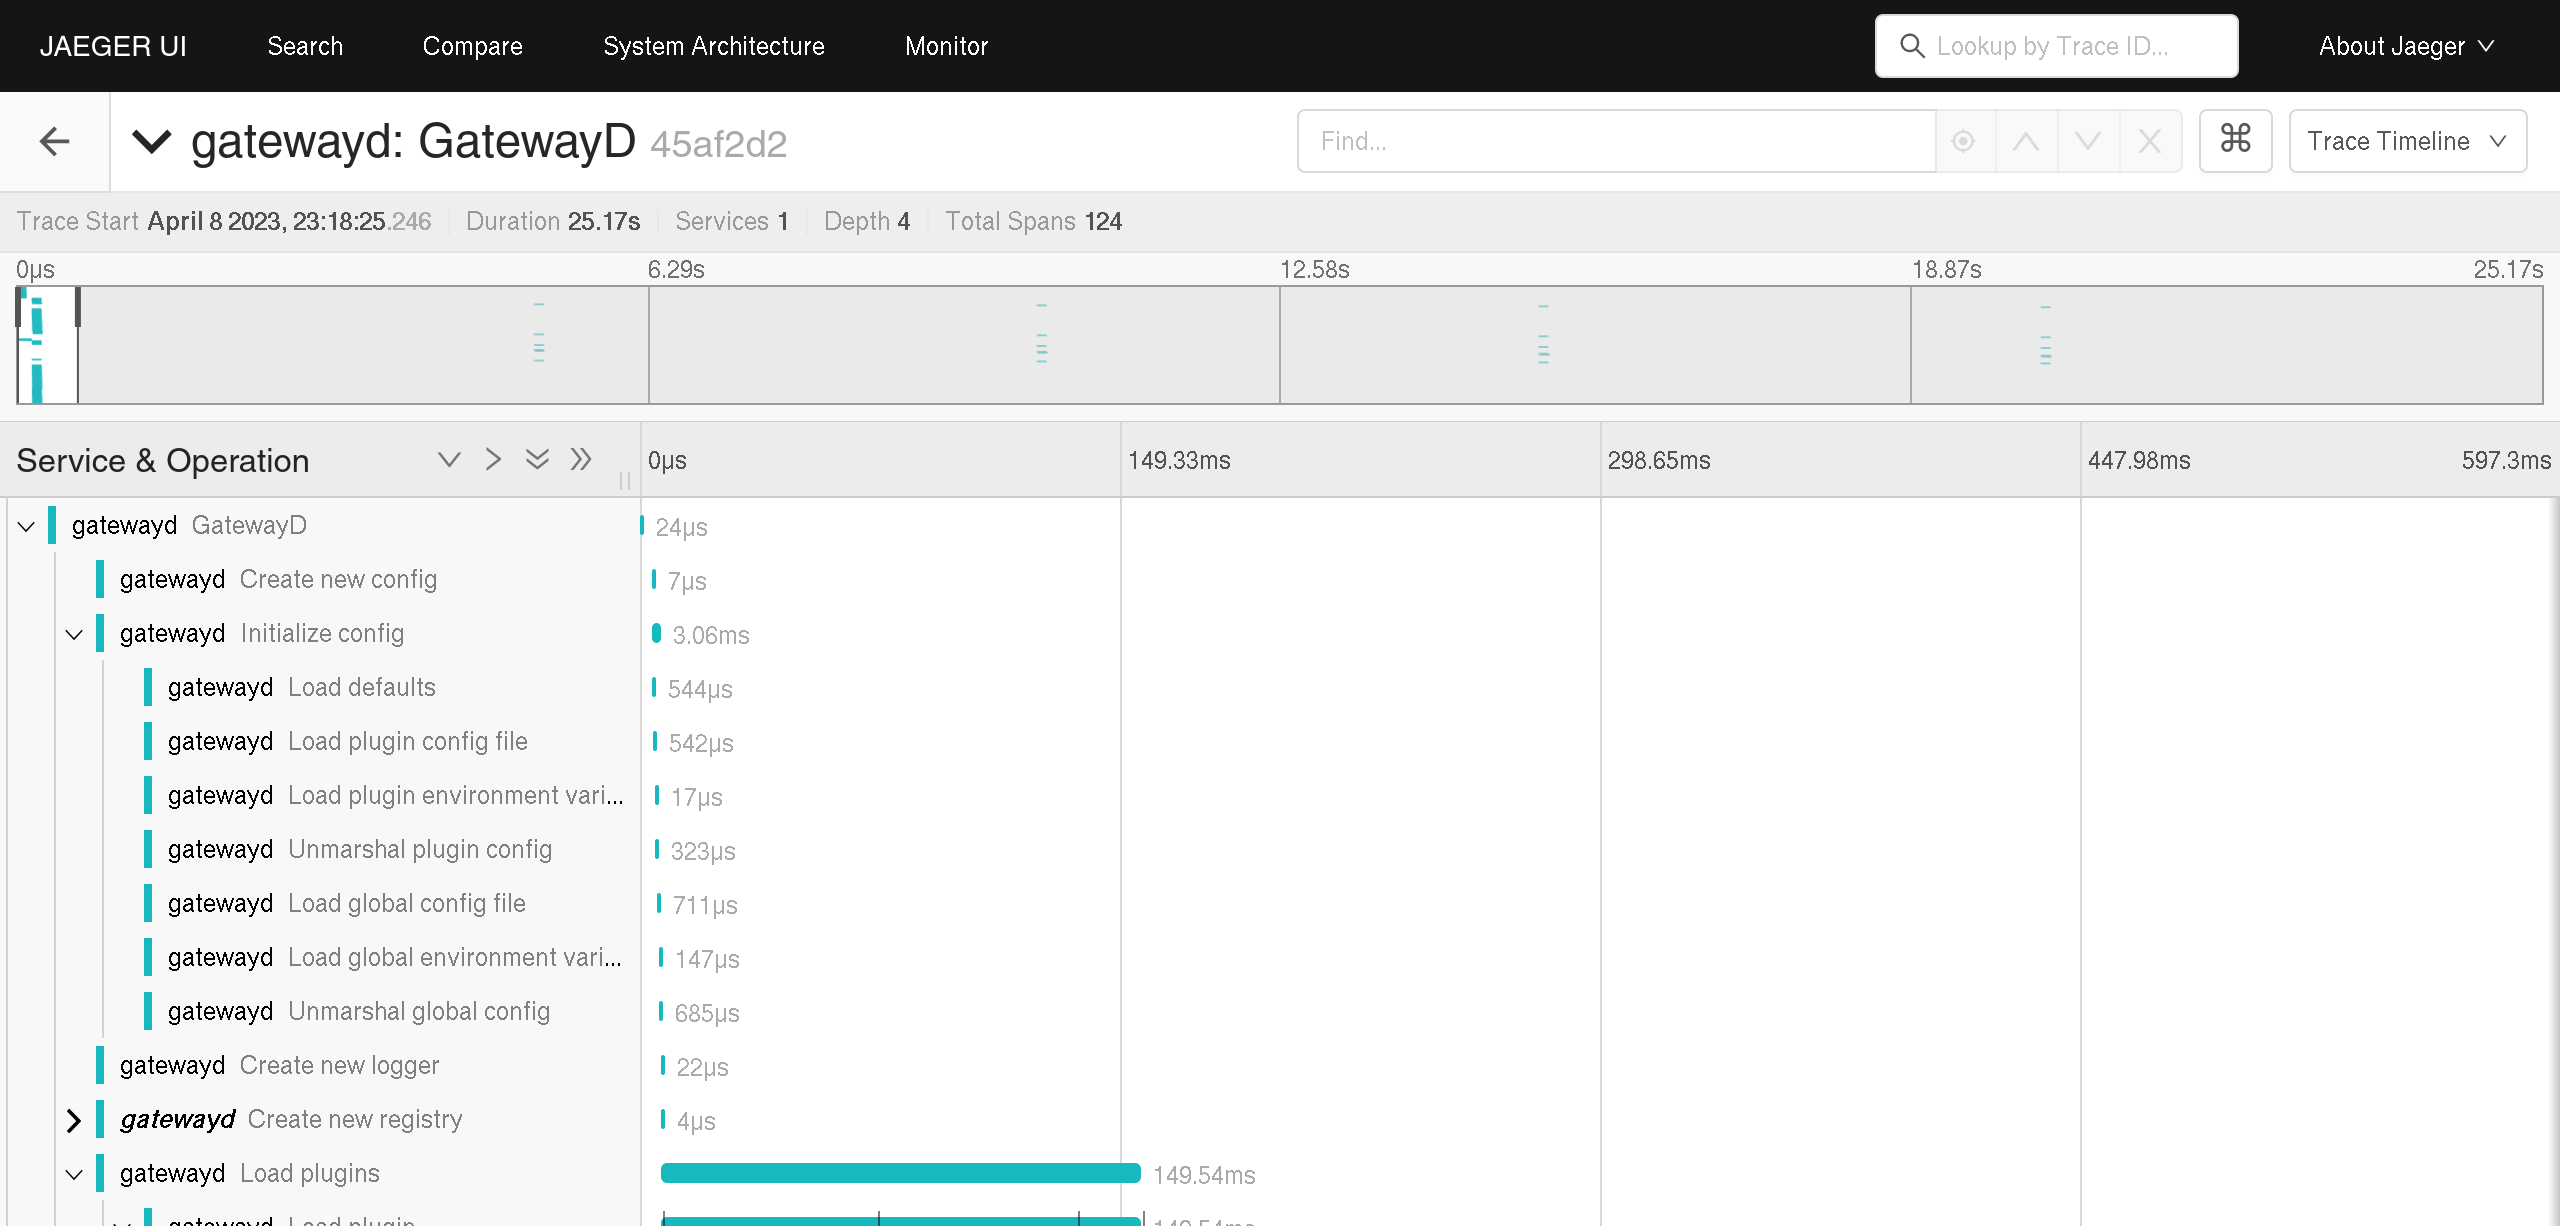
Currently the traces are generated for the following events and they are all grouped under the GatewayD service:
- Creation and initialization of GatewayD objects
- Sentry initialization (on
runonly) - Plugin health check and its events
- Metrics server
- Server start and shutdown
- Plugin metrics merger and its events
- Client events
- Proxy events
- Plugin registry events
- Pool events
Plugins can also generate traces, but they are not collected by GatewayD. The plugins can be configured to send traces to the supported backends individually in their configuration parameters.